
Expected Value in Betting: How to Turn Odds, Probability, and Stake Into One Decision
2026-08-28 · 30 min · 5,805 words
Two bettors back the same ten matches. The first one gets seven picks right. The second gets four. When the tickets settle, the seven-from-ten bettor has lost money and the four-from-ten bettor has made it. No accumulators, no hedging, no tricks. The first bettor backed heavy favorites at average odds of 1.40: seven winners paying 0.4 units of profit each, three losers costing a full unit each. That's 2.8 units in, 3 units out — a losing weekend on a 70% strike rate. The second bettor backed underdogs at 3.50: four winners paying 2.5 units each against six losers, which is 10 units in against 6 out.
The gap between being right and being paid properly for being right is the entire subject of expected value. Once you understand it, you stop asking "who's going to win?" and start asking the only question that makes money: "is this price bigger than this chance?"
Why Do Professional Bettors Talk About 'Value,' Not 'Winners'?
Watch a casual bettor work and you'll see a prediction exercise. They look at a fixture, decide who they think will win, and then check the odds almost as an afterthought — the odds just determine how much they collect when they're right. The whole process runs on confidence: the more sure they feel, the more they stake.
A professional runs the same fixture through a completely different machine. They estimate a probability for each outcome before looking at any prices. Then they compare their numbers against the odds on offer. If the bookmaker's price implies a lower probability than their estimate, they bet — even if it's on a team they think will probably lose. If the price implies a higher probability than their estimate, they pass, even on a team they think will probably win.
That second move is the one most people can't make themselves do, so be concrete about it. Say a dominant favorite is priced at decimal 1.40. That price implies a 71.4% chance of winning (we'll get to the conversion shortly). If your honest assessment puts them at 65%, then backing them is a mathematically losing play — even though they'll most likely win the match. You'll cash the ticket more often than not, and it will still bleed your bankroll over a season, because you're being paid as if a 71.4% thing is happening when a 65% thing is happening.
The flip side is just as uncomfortable. A longshot at 6.00 implies roughly a 16.7% chance. If your assessment says the true chance is 20%, that's a bet — even though you expect to lose it four times out of five. You're not buying the team. You're buying a mispriced probability, the way a trader buys an undervalued stock.
This is why profitability in betting comes from one habit repeated relentlessly: only placing bets where the odds on offer are better than the true probability of the outcome. Expected value is the number that tells you whether that's the case, and by how much. Everything else — models, staking plans, software — exists to serve that single comparison.
What Is Expected Value? A Simple Coin Toss Example
You own a strange coin. You've flipped it ten thousand times in a lab and it lands heads 60% of the time. A friend, who hasn't done the research, offers you even money on heads: $100 if it comes up heads, you pay him $100 if it comes up tails. Should you take the bet?
Expected value answers this with one line of arithmetic:
EV = (probability of winning × amount won) − (probability of losing × amount lost)
Plug in the coin: (0.60 × $100) − (0.40 × $100) = $60 − $40 = +$20. Every time you flip this coin under these terms, you expect to make $20 on average. Flip it a thousand times and you expect to walk away with something in the region of $20,000.
Now notice what EV is not. It is not a prediction. On any single flip you will never win $20 — you'll win $100 or lose $100, full stop. Forty percent of the time you'll lose, and you might lose three, four, five flips in a row through no failure of logic. EV is the average result per trial if the same event were repeated thousands of times. It's a statement about the long run, and only about the long run.
The same frame tells you when to walk away. If your friend insists on the other side of the coin — even money on tails — the calculation becomes (0.40 × $100) − (0.60 × $100) = −$20. That's a bet you refuse no matter how lucky you feel, because every flip costs you $20 in expectation. Betting against a negative expected value is paying for entertainment. Sometimes that's fine. Just know the price.
Real betting is this coin game wearing a disguise. The coin is the sporting event, the "true" probability is hidden instead of lab-tested, and the odds determine whether you're being offered the good side or the bad side of the flip. Everything that follows is about stripping off the disguise.
The EV Formula: How Odds, Probability, and Stake Combine
The betting version of the formula swaps in terms you'll see on a sportsbook screen:
EV = (win probability × profit if the bet wins) − (loss probability × stake)
Three components, and each one earns its place:
- Profit if won comes straight from the decimal odds: profit = (odds − 1) × stake. At odds of 2.50 with a $100 stake, your profit is (2.50 − 1) × $100 = $150. This is the number people get wrong most often — your total return would be $250, but $100 of that is your own stake coming home. Only $150 is profit.
- Loss probability is just the mirror of your win probability: 1 − p. If you rate the outcome at 45%, the loss side is 55%. In a two-way or three-way market these don't have to be one exact event; "the bet loses" covers everything that isn't your pick.
- Stake scales everything linearly. Double the stake, double the EV in dollars. That's why serious bettors express EV as a percentage of stake — it makes bets comparable across different stakes and bankrolls.
Run a full example. A bookmaker offers decimal 2.50 on an outcome you've assessed at 45%. Your stake is $100.
EV = (0.45 × $150) − (0.55 × $100) = $67.50 − $55 = +$12.50
That's a positive EV (+EV) bet worth 12.5% of your stake: over an infinite number of identical situations, you expect to profit $12.50 per $100 wagered. If your assessment had been 35% instead, the same odds give (0.35 × $150) − (0.65 × $100) = $52.50 − $65 = −$12.50 — a negative EV (−EV) bet that you pass on, regardless of how the match feels. An EV of exactly zero is a break-even proposition before any costs, which in practice still means pass, because your probability estimate is never precise enough to trust a coin-flip-thin edge.
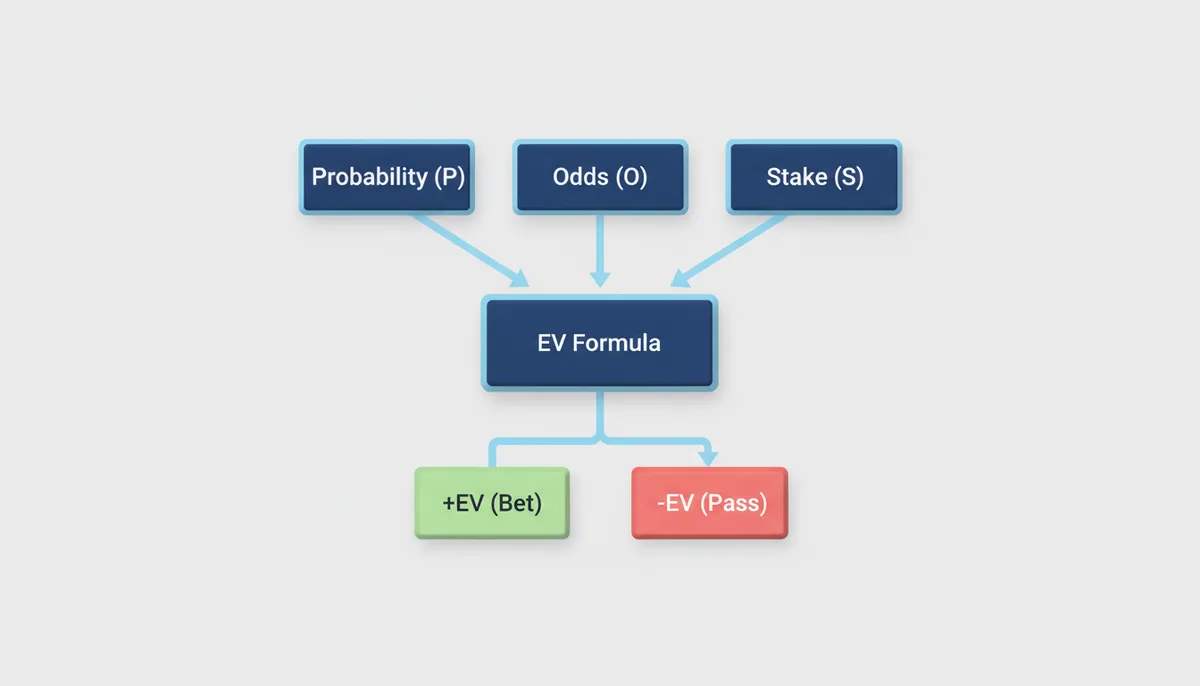
The decision rule that falls out of this is brutally simple: bet when EV is positive, pass when it isn't, and let the size of the EV — not your excitement about the game — tell you how good the opportunity is. The entire craft of betting profitably reduces to finding situations where the formula spits out a positive number, and being right about the inputs often enough to trust it.
How to Calculate Implied Probability from Any Odds Format
Odds are not a prediction. They're a price, and like every price, they include the seller's margin. The bookmaker's cut is called the vig, the juice, or the overround depending on where you grew up, and it's baked into every number on the board. Before you can compare a price to your own probability, you have to convert that price into the probability it implies — margin and all.
The conversions:
| Odds Format | Example | Formula for Implied Probability | Implied Probability | Key Characteristic |
|---|---|---|---|---|
| Decimal | 2.50 | 1 ÷ 2.50 | 40.0% | Quoted return includes your stake |
| Fractional | 6/4 | 4 ÷ (6 + 4) | 40.0% | Quotes profit relative to stake |
| American (positive) | +150 | 100 ÷ (150 + 100) | 40.0% | Profit on a $100 stake |
| American (negative) | −200 | 200 ÷ (200 + 100) | 66.7% | Amount you must stake to win $100 |
Notice that the first three rows are the same bet in three costumes. The format changes nothing about the underlying proposition — it's regional display convention. Do all your EV work in decimal odds. The math is cleaner (profit = odds − 1 times stake) and you eliminate an entire category of conversion errors.
Now the margin. Take a soccer match priced at decimal 2.10 for the home win, 3.40 for the draw, and 3.60 for the away win. Convert each: 1 ÷ 2.10 = 47.6%, 1 ÷ 3.40 = 29.4%, 1 ÷ 3.60 = 27.8%. Add them up and you get 104.8%. Probabilities of all possible outcomes of an event must sum to 100% — that's what probability means. The extra 4.8 percentage points are the bookmaker's overround: their theoretical profit margin if they take balanced action on all three outcomes.
Every market works this way. A tennis match with both players at 1.90 sums to 105.3%. A huge favorite and a huge underdog might sum to 103% or 108% depending on the book and the market's liquidity. Two lessons follow. First, you are not competing against a fair price — you have to beat the margin before you beat anything. Second, when you later estimate a "true" probability, you should compare it against a margin-free benchmark, or you're grading yourself against a rigged scale. The next two sections show how to build that benchmark.
Where Does 'True' Probability Come From? (The Hard Part)
Everything so far has been arithmetic. This section is the craft. Estimating true probability more accurately than the market — for specific outcomes, repeatedly — is the single skill that separates winning bettors from everyone else, and no article can hand it to you. What it can hand you is the map of where defensible numbers come from. There are three main sources.
1. Build your own statistical model. For low-scoring sports like soccer, the workhorse is the Poisson distribution — a formula that turns an "expected goals" figure into the probability of a team scoring exactly 0, 1, 2, 3 or more goals. You estimate each side's expected goals from their attacking and defensive strength relative to the league average, adjusted for home advantage. Say your numbers give the home team an expectation of 1.6 goals and the visitors 1.1. Poisson converts each of those into a full distribution of score probabilities, and combining the two distributions gives you a grid covering every plausible scoreline. Sum the grid cells where the home team wins and you have your probability for the home win; do the same for the draw and the away win. The model's output is probabilities, not tips — which is exactly what the EV formula eats.
2. Use an established rating system. Elo ratings are the classic: every team carries a number, the gap between two numbers maps to an expected result share through a standard curve, and ratings update after each match based on how the result compared to the expectation. Beat a stronger side and your rating jumps; scrape past a weak one and it barely moves. Elo won't outsmart a sophisticated market on its own, but it's an honest baseline, it forces discipline, and it gives you a probability with a documented pedigree rather than a vibe.
3. Reverse-engineer a sharp bookmaker's line. This is what most working value bettors actually do day to day. Certain bookmakers — Pinnacle is the name everyone uses as the reference — run high limits, welcome winning players, and see enormous volume from sophisticated syndicates. Their prices, especially close to kickoff, are the closest public thing to the market's honest opinion. So you take their line and strip out the margin: convert each outcome's odds to implied probability, sum them, then divide each implied probability by that sum. If the three outcomes imply 43.5%, 28.6% and 32.3% against a total of 104.3%, the margin-free estimates are 41.7%, 27.4% and 30.9%. One honest caveat: this proportional method assumes the margin is spread evenly, when in practice bookmakers load a bit more of it onto longshots (the well-documented favorite-longshot bias). For most purposes the error is small enough to live with.
What you don't do is trust your gut. Unaided human judgment drags a trailer of exploitable biases behind it: recency bias (overrating what happened last weekend), allegiance bias (your team is always "due"), and a systemic preference for backing favorites and overs at prices that punish both. Bookmaker models are built and refined against millions of bets placed by people running on exactly these instincts. Your gut is their customer base.
My working rule, and I'd suggest making it yours: if you can't point to where a probability number came from — a model, a rating, a de-vigged sharp line — then you don't have a probability. You have a hunch, and hunches are −EV by default.
A Step-by-Step Walkthrough: Finding a +EV Bet in a Real Match
Let's run the whole pipeline on a realistic scenario: a Premier League fixture with a top-four side playing away at a mid-table team. Nothing here requires inside information — just prices, conversions, and arithmetic.
- Find the odds. You scan the market and notice one mainstream sportsbook hanging decimal 2.50 on the away win, while most other books sit between 2.35 and 2.45. That outlier is the scent. +EV prices almost always look like this — one book slightly out of line with the pack, usually because they're slower to update or they're managing their own liabilities.
- Convert to implied probability. 1 ÷ 2.50 = 40.0%. The book is pricing the away win as if it happens four times in ten.
- Build your true probability. You check your sharp reference book: home 3.10, draw 3.50, away 2.30. Converting: 32.26%, 28.57%, 43.48%. The total is 104.31%, so strip the margin proportionally — divide each figure by 1.0431. The margin-free estimate for the away win comes out at 41.7%. That's your p, sourced from the most efficient price-setter available.
- Run the EV formula. Profit on a $100 stake at 2.50 is (2.50 − 1) × $100 = $150. Loss probability is 1 − 0.417 = 0.583. So: EV = (0.417 × $150) − (0.583 × $100) = $62.55 − $58.30 = +$4.25.
Read that number properly. +$4.25 on a $100 stake is a 4.25% expected return: for every dollar you put on this bet, you expect to get back your dollar plus about four cents, on average, over the long run. Place five hundred comparable bets at $100 each and your expected profit is roughly $2,100 — though the actual path there will wobble violently around that line, which is the subject of the next section.
Two quality checks before you ever stake a cent. First, the size of the edge: sustainable +EV spots in major markets typically land in the 1% to 5% band, and 4.25% sits comfortably inside it. If your spreadsheet had spat out +25%, that's not a golden ticket, it's a bug report — you'd recheck the odds you typed and the line you de-vigged before believing it. Second, the direction of the disagreement: your p (41.7%) is only slightly above the outlier book's implied probability (40%), and the rest of the market prices between you and them. You're not claiming the world is wrong by miles. You're claiming one book is wrong by a little, which is exactly the shape a real edge takes.
Why a Single Bet's Outcome Doesn't Matter (But the EV Does)
You place the bet from the last section — a genuine 4.25% edge — and the away side concedes in the 89th minute and loses. Was the bet wrong? No. Was the process wrong? No. Will this keep happening to you, regularly, for as long as you bet? Yes, and accepting that is the psychological price of the whole strategy.
The mechanism is variance: the gap between what probability expects and what actually happens over a finite stretch of trials. Even excellent bets lose constantly. A wager with a true 60% chance at good odds still fails four times in ten, and failures cluster. Run the streak math on a solid winning profile — a bettor who hits 55% of even-money bets: the chance of any specific five-bet stretch all losing is 0.455, about 1.8%. Sounds rare. But over hundreds of bets there are hundreds of overlapping five-bet windows, which means losing runs of five, six, seven are not a sign that your model broke. They're a mathematical appointment you scheduled the day you started.
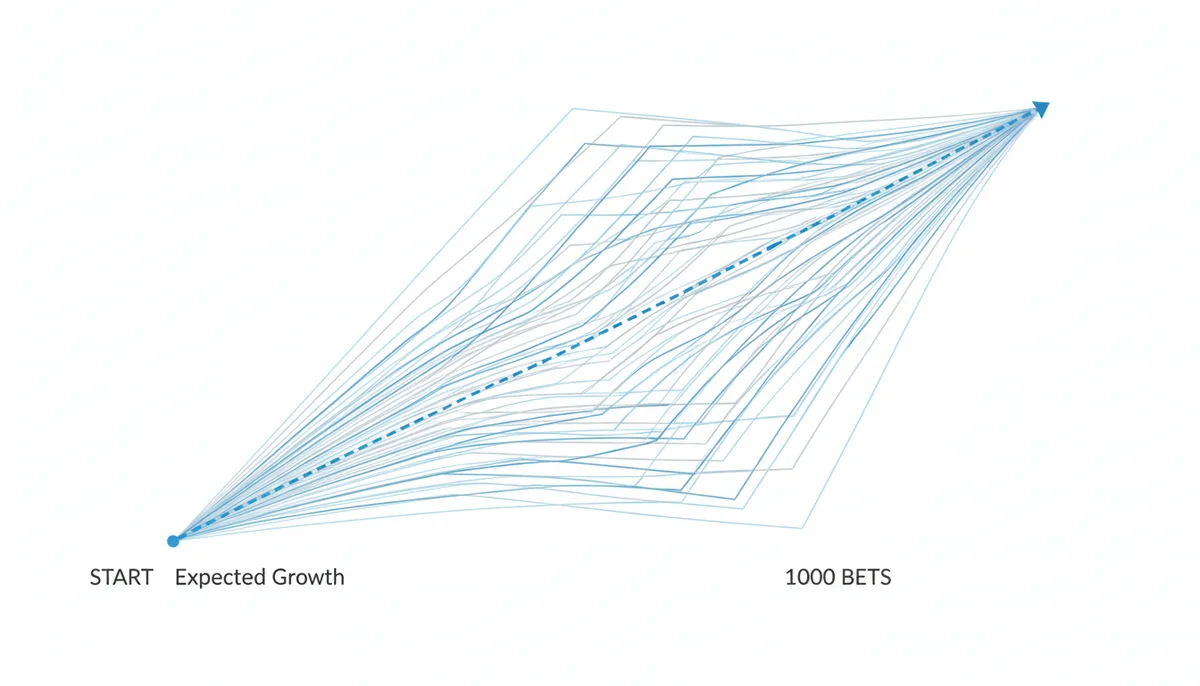
The counterweight is the Law of Large Numbers: as your number of bets grows, your actual return converges toward your expected value. Ten bets are nearly pure noise. A hundred bets are mostly noise. A thousand bets start to tell the truth, and five thousand tell it fairly precisely. This is why professionals think in seasons and samples, and why they track results in spreadsheets rather than memories — the memory remembers the bad beat, the spreadsheet remembers the average.
If you want the mindset in one image, look at the entity on the other side of every casino floor. A European roulette wheel has 37 pockets; a bet on red wins 18 of them and gets paid as if it were a coin flip. The casino's edge is a sliver — 2.7% of everything wagered — and the casino loses individual spins constantly, sometimes for an entire loud, expensive evening at one table. It doesn't care. It owns millions of spins, and at millions of spins the 2.7% is as reliable as gravity. Value betting is you trying to become that casino: small edge, huge sample, total indifference to any single outcome. The next figure is what that journey actually looks like.
The Most Common Mistakes When Calculating and Using EV
EV is a simple formula fed by human judgment, and the failure points are almost all in the feeding. These three do the most damage.
Overestimating your own probability
This is the killer, because the formula cannot protect you from a bad input — it will happily amplify it. Say a market is priced at decimal 2.00, an implied 50%. If the true probability is 52% and you've talked yourself into 60%, the arithmetic looks like this: your sheet reports (0.60 × $100) − (0.40 × $100) = +$20 per $100, a monster 20% edge, when the real figure is (0.52 × $100) − (0.48 × $100) = +$4. The bet is still fine — but it's a small edge being sized and treated like a lock. Do that across a season with an aggressive staking plan and the variance you weren't prepared for will find you. The defense is humility with a mechanism: anchor every estimate to something external (a model, a de-vigged sharp line), and treat any edge above 5% as a request to double-check your work, not a reason to load up.
Ignoring or miscalculating the margin
The vig hides in plain sight and quietly flips the sign on your EV. Classic case: a book offers 1.90 on both sides of a two-way market — a tennis match, a totals line. It looks close to a coin flip with a small fee. It's worse. Each side implies 52.6%, the book sums to 105.3%, and if the outcome genuinely is 50/50, your EV is (0.50 × $90) − (0.50 × $100) = −$5 per $100. You're paying a 5% toll on a bet that "felt" nearly fair. Multiply that by the hundreds of even-odds-looking bets a casual bettor places in a year and you can see where the money goes. Never compare your probability to raw odds; always convert to implied probability first, so the margin is visible on the page in front of you.
Abandoning the process when variance bites
The third mistake is emotional, and it's usually triggered by the losing streaks the previous section proved are inevitable. After three losing +EV bets, people do one of two things: they quit the system ("it doesn't work"), or they chase — abandoning flat stakes for a doubling progression to win the losses back. Chasing deserves a concrete autopsy. Start at $10 and double after every loss: 10, 20, 40, 80, 160, 320. Six straight losses — utterly normal in any betting career — put you $630 down, and the seventh step demands $640 to win back a net total of $10. One more loss and you're either at the table limit or out of bankroll, having risked over a thousand dollars to protect a ten-dollar profit. You can run the sequence yourself in SorteCalc's Martingale System Calculator with any starting stake you like; the shape never changes, only the speed of the crash. A staking plan that collapses under a routine downswing isn't a staking plan. It's a countdown.
Beyond EV: What Is Closing Line Value (CLV) and Why Is It a Better Metric?
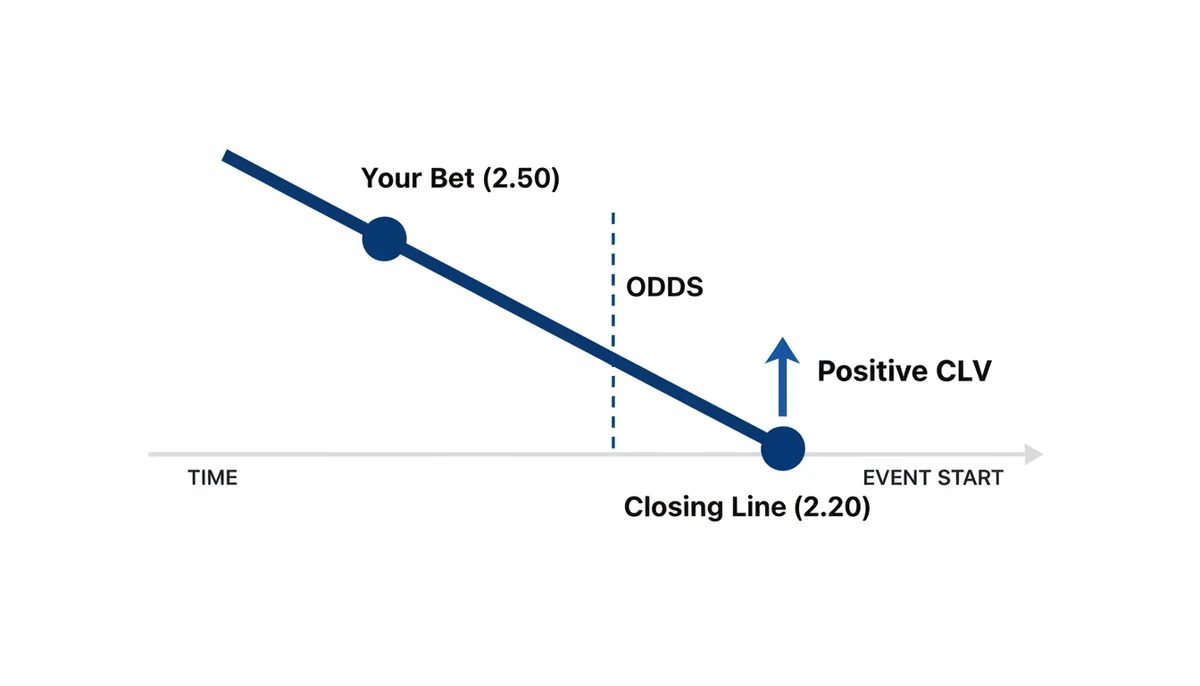
There's a problem with using EV as your scoreboard: your true probability is an estimate, so your EV is an estimate of an estimate. Closing Line Value gives you an external referee. CLV is the difference between the odds you took and the final odds — the closing line — offered just before the event starts.
Back to the earlier example. You took 2.50 on the away win on Tuesday. Through the week, team news drops, money arrives, and by kickoff the market has moved: the away win now closes at 2.20 across the sharp books. Your ticket at 2.50 implies a 40% chance; the closing price implies 45.5%. You hold a bet that the market's final, most informed verdict says is worth more than what you paid. That gap is positive CLV, and you banked it regardless of how the match ends.
Why treat the closing line as the gold standard? Because it's the price with the most information and the most money behind it. Every injury update, every tactical leak, every syndicate model has had its say by kickoff, and limits are at their highest precisely when the book is most confident in the number. Empirically, the closing line is the most accurate public estimate of true probability that exists — which makes "did I beat the close?" a clean yes/no test of whether your number was better than the market's.
This is why serious bettors track CLV on every single bet and treat it as a better measure of skill than short-term profit. Profit over 50 or 100 bets is drenched in variance; CLV is not. Two bettors can post identical +8% returns over a month — one consistently beating the closing line, one consistently taking prices worse than the close and getting bailed out by lucky results. The first has a business. The second has borrowed money from the variance gods, and the repayment schedule is brutal. If you beat the close consistently, profit follows with near-mechanical reliability. If you lose to the close consistently, no hot streak changes what you are: the person paying the margin.
How Does EV Inform Your Staking Strategy? The Kelly Criterion
Finding a +EV bet solves half the problem. The other half — how much of your bankroll to risk — is where most bettors improvise, and improvisation is where good edges go to die. The mathematical answer is the Kelly Criterion, a formula that sizes each bet to maximize the long-term growth rate of your bankroll given your edge:
f* = (bp − q) ÷ b
where b is the decimal odds minus 1 (your profit per unit staked), p is your win probability, and q is 1 − p. The output, f*, is the fraction of your bankroll to stake.
Run it on the bet from our walkthrough: odds 2.50, so b = 1.5; your p = 0.42, so q = 0.58. Then f* = (1.5 × 0.42 − 0.58) ÷ 1.5 = (0.63 − 0.58) ÷ 1.5 = 0.05 ÷ 1.5 ≈ 0.033. Full Kelly says 3.3% of your bankroll. Notice what the formula does automatically: bigger edge, bigger stake; no edge at all and f* comes out zero or negative, which is Kelly's way of telling you to stay out. It also re-scales as your bankroll moves — stakes shrink during downswings and grow during upswings, which is a built-in survival mechanism.
Now the part everyone skips, at their peril. Full Kelly is ferociously aggressive, and it assumes your probability estimate is exactly right. Remember the overconfidence mistake: if your true edge is 2% but you believe it's 5%, Kelly doesn't just over-bet a little — it roughly doubles the correct stake, and oversized stakes turn normal variance into account-killing drawdowns. Drawdowns under full Kelly are savage even when your numbers are right; 50% bankroll declines are a normal part of the journey, not a catastrophe.
The standard professional answer is fractional Kelly: bet half the Kelly fraction (1.7% in our example) or a quarter (0.8%). You give up some theoretical growth rate and buy a dramatic reduction in volatility and ruin risk — most working bettors consider that the best trade available in the whole discipline. If you don't want to run the algebra by hand, SorteCalc's Kelly Criterion Calculator takes the odds and your probability and returns the stake fraction directly, which at least removes arithmetic errors from a decision that already has enough judgment errors available.
How Calculators and Software Speed Up Your EV Workflow
Everything in this article is doable by hand. That's exactly the problem. Per match, the manual loop runs: find prices across books, convert to implied probabilities, de-vig the reference line, compare, compute EV, compute stake. Do it properly and one market takes several minutes; do it across a weekend card of dozens of fixtures and markets and you're looking at hours of arithmetic with a fresh opportunity for a keystroke error at every step. Tools don't add intelligence to this process — they add speed, coverage, and error removal.
| Tool Type | Primary Function | Who It's For | How It Helps Your EV Strategy |
|---|---|---|---|
| Odds comparison site | Lists every book's price for the same market side by side | Beginner | Surfaces the outlier price, which is usually where the +EV bet lives |
| EV calculator | Turns odds plus your probability into an instant EV figure | Beginner to intermediate | Removes arithmetic mistakes and makes the bet/pass decision mechanical |
| Arbitrage finder | Scans for cross-book price sets whose implied probabilities sum under 100% | Intermediate | Locks in a small guaranteed margin — the low-variance cousin of value betting |
| Betting model software | Builds and backtests your own probability estimates against historical data | Professional | Produces the "true" probability that every other calculation depends on |
One distinction in that table deserves emphasis. Arbitrage and value betting are relatives, not twins. An arb exists when two books disagree so much that backing all outcomes across both books guarantees a profit — tiny, usually a percent or two, but certain and immediate. Value betting takes one side of a single mispriced outcome: the edge is typically larger, but you carry full variance on every bet. Arbs also tend to get accounts limited quickly, because they're trivially easy for bookmakers to spot. Many bettors run both, treating arbs as low-risk income and value bets as the growth engine.
SorteCalc's suite sits in the middle of this workflow — 50 calculators covering sports betting EV, Kelly staking, arbitrage and bankroll management, so the convert-compare-size loop runs in one place instead of a sprawl of spreadsheets. Use it for what tools are actually for: killing arithmetic errors and saving time. No calculator supplies the input that matters — your probability estimate still has to come from the hard work in section five. Software that speeds up a sound process multiplies your edge; software that speeds up a sloppy one just helps you be wrong more efficiently.
Frequently Asked Questions
Is +EV betting a guaranteed way to make money?
No, and anyone who tells you otherwise is selling something. +EV betting is profitable on average, over many bets — the guarantee lives in the long run, not in any individual week or month. Variance guarantees you'll lose plenty of individual bets, including bets you priced perfectly, and you'll hit losing streaks and multi-week downswings that feel indistinguishable from failure. The casino has a guaranteed edge on every roulette spin and still loses money on individual tables on individual nights. What it never loses is the year. Your edge works the same way, at a smaller margin, which means you need the same things the casino has: volume, discipline, and a bankroll built to survive the swings.
Can I use EV for casino games like roulette or slots?
Yes — the math works identically, it just always returns a negative number. In standard casino games the payout structure builds the house edge into every bet, so EV's job changes: it tells you the exact price of playing. European roulette is the cleanest illustration. Red pays even money but wins only 18 of 37 spins, so EV = (18/37 × $100) − (19/37 × $100) = −$2.70 per $100 wagered. Switch to an American wheel with the extra double-zero pocket and it's −$5.26 for the same bet. That's EV's honest use in a casino: not finding winners — there are none — but showing you which games tax you least for the entertainment.
What if I can't find any +EV bets?
Welcome to most days. Bookmakers price major markets with sophisticated models and enormous data, and those markets are efficient far more often than not. If your comparison shows no value, the market is telling you it's done its job. The professional response is to not bet. Passing costs you nothing — an EV of exactly zero, which beats every −EV ticket ever written. The amateur response is to lower standards out of boredom, which quietly donates back whatever edge you earned elsewhere. If "no bets" becomes a pattern, the fix isn't looser criteria; it's wider line shopping across more books, or more work on your probability estimates.
How much of a bankroll do I need to start value betting?
There's no minimum figure, but there is a hard rule: it has to be money you are fully prepared to lose, because variance can take large chunks of it even when you're doing everything right. The starting amount matters far less than how you stake it. A disciplined plan — flat 1% of bankroll per bet, or fractional Kelly — lets a small bankroll survive the inevitable downswings long enough for your edge to show up in the results. Random, emotional staking will destroy a large bankroll faster than a losing strategy would. Build the discipline first; the size of the roll is a detail.
What's a 'good' EV percentage to look for?
Most sustainable +EV opportunities in efficient markets land between 1% and 5%. That's the realistic band, and it's plenty — a consistent 3% edge over thousands of bets compounds into serious money. Be deeply skeptical of anything your calculations put above 10%. That almost never means you've found a golden ticket; it means one of your inputs is wrong. Usually it's your probability estimate (see the overconfidence mistake), sometimes it's stale odds or a misread market. When your sheet says +15% and the sharp market disagrees, the market is nearly always right. Recheck your work before you celebrate.
If a bet is +EV, does that mean the bookmaker made a mistake?
Not necessarily. It means your assessed probability differs from the one baked into their price — and you should hold that thought with some humility, because their models are usually better informed than yours. Bookmakers also aren't always trying to post the "correct" price. Their primary goals are to balance liability across outcomes and lock in their margin, so prices move with betting flow as much as with pure probability. A +EV bet is your claim that, for this specific outcome at this specific moment, your number is sharper than theirs. Sometimes that's because they erred. Often it's because they had commercial reasons to shade the price. Either way, the bet stands or falls on the quality of your estimate — which is why tracking CLV matters more than any single result.
Does EV account for the bookmaker's margin (the 'vig')?
Not automatically — this is one of the most common points of confusion. The EV formula takes the odds and your probability as given inputs; it has no idea whether the odds contain a margin. The vig lives inside the odds themselves, which is why the implied probabilities of all outcomes in a market always sum to more than 100%. The correct workflow handles the margin explicitly: convert the bookmaker's odds to implied probability (vig included), compare that against your true probability estimate — ideally one built from a de-vigged sharp line or a model — and only then run the EV calculation. Skip the conversion step and you'll spend a season grading −EV bets as acceptable, wondering why the math "isn't working." The math always works. The inputs are where the battle is.
Sources
- Pinnacle — The concepts of sharp bookmakers, efficient markets, closing line value, and removing the margin ('vig') to estimate true probability.
- Investopedia — The financial and mathematical principles behind the Kelly Criterion for optimal capital allocation and risk management.
- American Gaming Association (AGA) — Data and research on the scale of the regulated sports betting market, providing context for the industry in which EV principles are applied.
- UK Gambling Commission — Official definitions and consumer guidance on betting terms, including how odds work, which underpins the section on converting odds to implied probability.
- Harvard University Department of Statistics — The fundamental mathematical theory of Expected Value and probability, backing the core formulas and the Law of Large Numbers.