SorteCalc vs OddsJam: Free Calculators or a Paid Odds Scanner for EV and Arbitrage?
2026-09-25 · 21 min · 4,009 words
Here's a purchase I watch bettors regret constantly: a $200-a-month OddsJam subscription, bought the same week they learned what "+EV" means, cancelled three months later because a screen full of flagged bets never turned into the profit they expected. The tool worked fine. The bettor wasn't ready for it — they couldn't size a stake, didn't know why a line had been flagged, and froze the first time one leg of an arbitrage bet moved before they could place the other.
The SorteCalc vs OddsJam question gets asked like it's a feature shootout. It isn't. One product is a box of precision instruments you operate yourself; the other is a scouting service that does the searching for you and charges accordingly. Which one fits depends on how you actually bet — your volume, your bankroll, and whether you can already do the underlying math without help. So let's put real numbers on it.
A Calculator vs. a Scanner: What's the Real Difference?
Strip both products down to what they actually do and the comparison gets simple. SorteCalc is a suite of 50 free gambling calculators — sports betting EV, arbitrage, Kelly Criterion, bankroll tools, plus poker, blackjack, roulette, and slots math. It has no connection to any sportsbook. It doesn't know what tonight's lines are. You bring the numbers, it does the arithmetic instantly and correctly. Think of it as a mechanic's toolbox: every tool in there is precise and reliable, but nothing happens until you pick one up.
OddsJam is the opposite arrangement. It's a subscription platform that pulls live odds from dozens of sportsbooks through automated feeds, compares them against each other and against sharp reference lines, and flags bets that look mathematically profitable — positive EV wagers, arbitrage situations, middles. It finds the opportunities; you decide whether to bet them. It's less a toolbox and more a scouting service that phones you when it spots something.
So the real decision isn't "which is better." It's this: do you need help finding opportunities, or help analyzing them? My strong opinion, after watching a lot of people go through this: if you can't yet calculate expected value by hand, discovery is not your bottleneck. You could be shown fifty +EV bets a day and still lose money through bad sizing and panic decisions. Learn the math first. It's free to do so.
How Each Tool Tackles Positive EV Betting
A quick refresher with real numbers, because everything else in this article builds on it. American odds of +130 mean a $100 stake returns $130 in profit. Convert any odds to an implied probability — the break-even win rate baked into the price — and +130 implies 43.5% (100 divided by 230). If you believe the true probability of that outcome is higher than 43.5%, the bet has positive expected value. If it's lower, the bet is −EV no matter how good it feels.
Where does "true probability" come from? Usually from a sharp bookmaker's line with the vig stripped out. The vig (or juice) is the bookmaker's built-in margin, and it's why both sides of a market sum to more than 100%. Take a standard −110/−110 market: each side implies 52.38%, the pair sums to 104.76%, and dividing each by that total gives you the fair estimate — 50/50. That no-vig price from a sharp book like Pinnacle is the benchmark most +EV bettors measure against.
The OddsJam workflow automates all of that. Its software continuously compares each sportsbook's lines against sharp references, and when a recreational book hangs a price that's out of line, the bet appears on your +EV screen with an estimated edge. A typical flag might read: BetMGM has +105 on a market that prices out as a pick'em after vig removal — a 2.5% edge. You see dozens of these, filterable by sport, book, and edge size, updated in near real time.
The SorteCalc workflow runs in reverse. You spot the line yourself — maybe you're comparing a prop across three book apps and notice FanDuel is still dealing +130 when everywhere else has moved to +110. You estimate the true probability yourself, say 45% based on the sharp market. Then you open the EV calculator, enter the odds and your 45% estimate, and it tells you: EV = 0.45 × $130 − 0.55 × $100 = +$3.50 per $100 staked. A 3.5% edge, confirmed before you risk a cent.
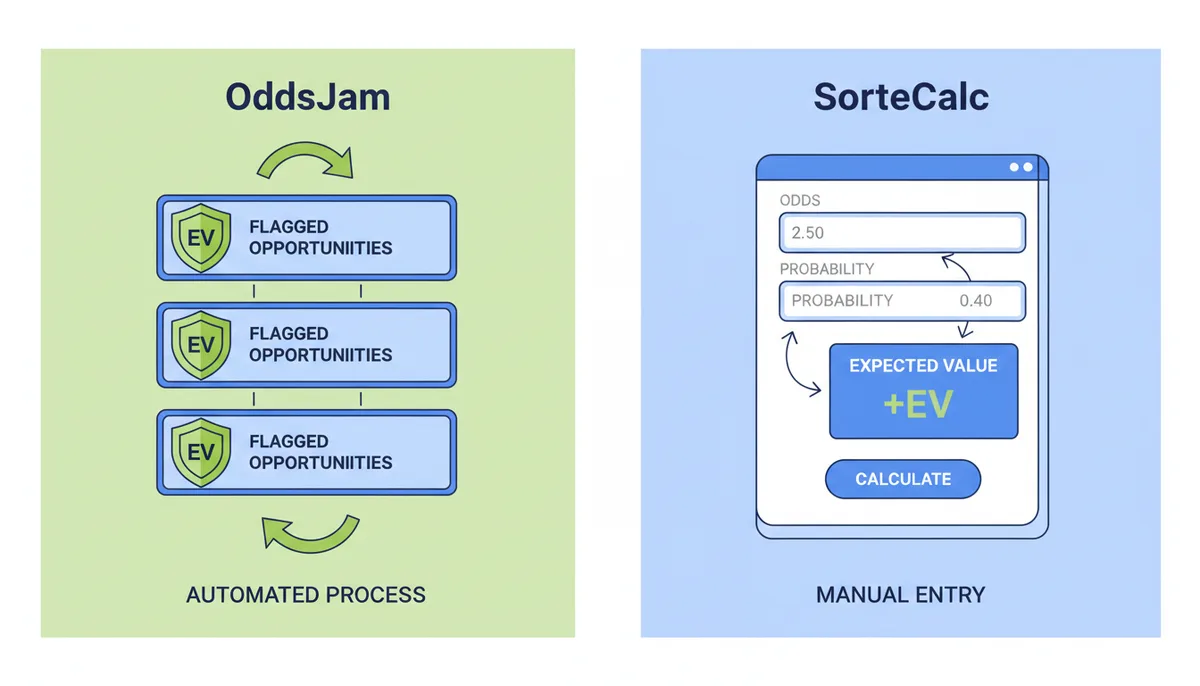
The difference that matters isn't speed — it's what each process does to you. OddsJam tells you that a bet is +EV. Doing the calculation by hand teaches you why: what a fair price looks like, how much the vig costs you, how thin a 3% edge really is. Run fifty bets through a manual calculator and you'll start spotting mispriced lines before you even reach for the tool. That judgment is the actual asset, and no subscription builds it for you.
Finding and Calculating Arbitrage Opportunities
Arbitrage is the one corner of sports betting where the math promises a guaranteed profit — and the one corner where speed decides whether you actually get it. A surebet exists when two sportsbooks disagree enough that betting both sides, in the right proportions, pays more than your total stake no matter who wins. The test: convert both prices to implied probabilities and add them. Under 100% means guaranteed profit.
Here's how to calculate arbitrage bets by hand, with a realistic example. Book A deals a moneyline underdog at +108 (implied 48.08%). Book B deals the favorite at −102 (implied 50.50%). Sum: 98.58%. That's an arb with a 1.45% return. To lock it in with $1,000 total, you split stakes in proportion to each implied probability: $487.70 on the dog, $512.30 on the favorite. Either outcome pays back roughly $1,014.50. You've made $14.50 regardless of the result.
Notice two things about that example. First, the margin is thin — real arbs typically return 1–3%, not the 5% fantasy versions people post about. Second, the stake split is annoying to compute in your head, and getting it wrong by even a few dollars unbalances the hedge. This is exactly where a surebet calculator earns its keep: enter both sets of odds and your total outlay, and the SorteCalc arbitrage calculator returns the profit percentage and the exact stake for each side. The arithmetic stops being the hard part.
The hard part is finding the arb before it disappears. OddsJam's arbitrage tool scans dozens of sportsbooks continuously and surfaces these pairs the moment they appear, with links straight to the bet slip. That matters because an arb created by a stale line at one book usually lasts minutes, not hours — sometimes seconds on a major market. By the time you've manually compared five books across tonight's slate, the window has often closed. Manual arb hunting mostly finds yesterday's opportunities.
And even automated discovery doesn't remove the nastiest risk in arbitrage: legging out. You place side A, and before you place side B the line moves. Now you're not arbitraging — you're just holding a bet. Latency, the gap between what your screen shows and what the book will actually accept, turns a guaranteed $14.50 into an exposed position. Every arb bettor gets caught by this eventually. The ones who survive it size their stakes so a legged-out position is an annoyance, not a disaster.
Feature-by-Feature Breakdown: SorteCalc vs. OddsJam
Comparing these two feature-for-feature is slightly unfair to both, because they aren't the same category of product — but the table below maps what an EV or arbitrage bettor actually cares about onto each one.
| Feature | SorteCalc | OddsJam |
|---|---|---|
| Cost | Free | Subscription, roughly $39–$199/month depending on tier |
| Primary function | Manual calculation suite: EV, arbitrage, Kelly Criterion, bankroll | Automated odds scanning with +EV, arbitrage, and middles alerts |
| Opportunity discovery | None — you find the odds yourself | Real-time flags across dozens of sportsbooks |
| Data source | Whatever numbers you type in | Live sportsbook feeds via API |
| Speed | As fast as you can line-shop and enter numbers | Near real-time; alert to placed bet in a few minutes |
| Required user input | All odds, probabilities, and stakes entered by hand | Pick from flagged opportunities and set your stake |
| Supported sportsbooks | Any book in the world — odds are entered manually | Major US books like DraftKings, FanDuel, BetMGM, Caesars, plus sharp references such as Pinnacle |
| Learning curve | Each calculator is simple; learning the math behind it is on you | Moderate — dashboards, filters, and settings to configure |
| Core focus | Understanding and verifying the numbers | Volume and speed of discovery |
Two rows in that table deserve more than a cell. The first is data source. A calculator is only as good as what you type into it — transpose two digits entering −140 and it will confidently confirm an edge that doesn't exist. An automated feed has the opposite failure mode: the numbers are real, but they may be seconds old, and seconds matter. Neither is "more accurate." They fail differently, and you should know which failure mode you're exposed to.
The second is everything outside the core EV/arb function. SorteCalc's extras lean toward education and breadth: calculators for poker equity, blackjack strategy, roulette systems, and slot RTP, plus written strategy guides, all available in English, Portuguese, Spanish, and Danish. If your gambling life extends beyond sports betting, the whole suite comes with you. OddsJam's extras lean toward operations: an odds screen for line shopping in one window, tools for middles and promotions, and a bet tracker that logs your results — the infrastructure of someone running betting like a business rather than studying it like a craft.
A Day in the Life: Comparing Betting Workflows
Abstract comparisons only go so far, so here's what placing one +EV bet actually looks like through each tool on a Tuesday night with a full slate.
With OddsJam: 6:40 PM — your +EV screen refreshes and flags a player prop: Caesars is dealing +105 on a market the sharp books price as a coin flip, an edge of about 2.5%. 6:41 — you click through to Caesars, confirm the line is still there (it usually is; sometimes it isn't). 6:42 — you decide your stake, place the bet, and it lands in the tracker. Total elapsed: under three minutes. Repeat that fifteen to thirty times across the evening and you've built a portfolio of small edges. The whole workflow is engineered around one insight: the edge is perishable, so friction is the enemy.
With SorteCalc: 6:40 PM — you open three book apps and start comparing a market you follow closely, because manual bettors do better specializing than scanning everything. 6:52 — you notice FanDuel hasn't moved a prop that moved everywhere else fifteen minutes ago; it's still +130. 6:54 — you check the sharp market, strip the vig, and estimate the true probability at 45%. 6:55 — the EV calculator confirms +$3.50 per $100. 6:56 — you open the Kelly Criterion calculator, which tells you a $2,000 bankroll justifies about $54 at full Kelly; you halve it to $27 because full Kelly is a rough ride. 6:58 — you place the bet and log it in your own spreadsheet. Total elapsed: about fifteen minutes for one bet — and you understood every number in the chain.
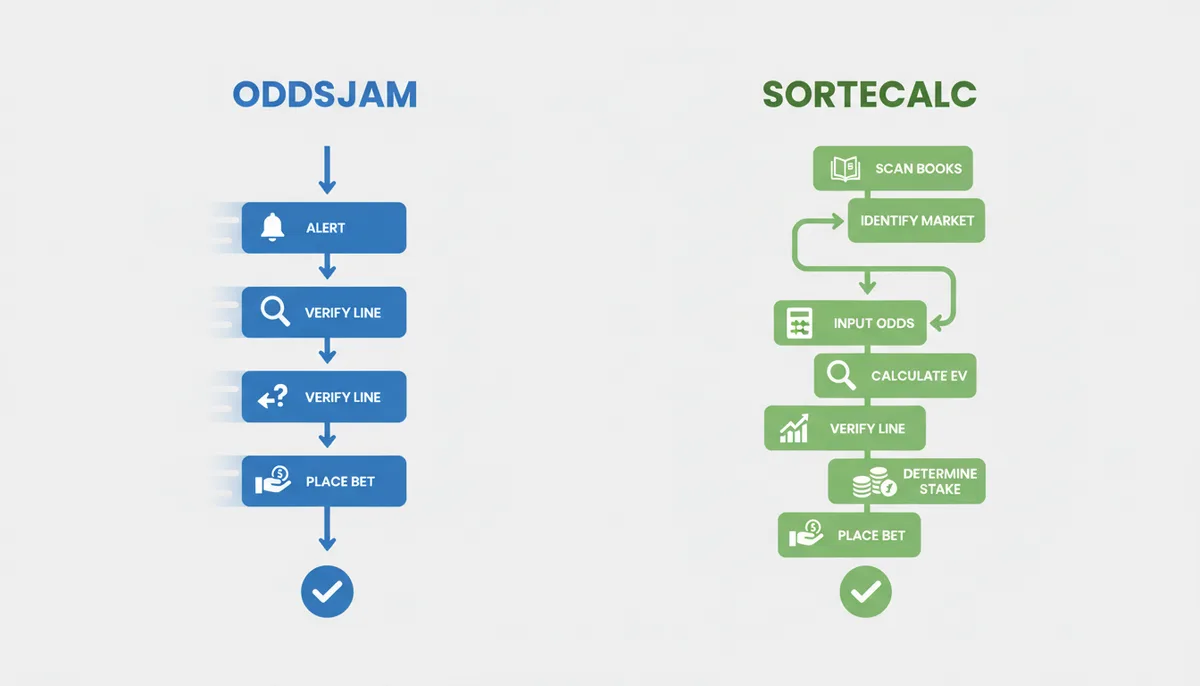
The throughput gap is real and there's no point pretending otherwise: twenty bets versus three in the same hour. But notice what the manual workflow builds that the automated one doesn't. After a month of evenings like that, the SorteCalc user can look at a line and estimate the fair price in their head. The pure OddsJam user has placed five hundred bets and may still not know why any single one of them was flagged. Both might be profitable. Only one of them keeps their edge if the subscription lapses.
The Bottom Line: Cost, Investment, and Potential ROI
SorteCalc costs nothing. Every calculator — EV, arbitrage, Kelly, bankroll, the lot — is free to use, which makes the price side of this comparison short. The interesting question is the other one: is OddsJam worth it?
OddsJam sells tiered subscriptions. At the time of writing, entry-level access with the core +EV tools runs around $39 a month, while the tiers that include the full arbitrage and middles scanners sit closer to $199 a month, with discounts for longer commitments. Plans and pricing change, so treat those as ballpark figures and check current offerings before budgeting.
| Tool | Cost | Best for |
|---|---|---|
| SorteCalc | Free | Learning the math and verifying lines you find yourself |
| OddsJam +EV tier | Around $39/month | Low-to-mid stakes bettors who want automated +EV flags |
| OddsJam arbitrage tier | Around $199/month | High-volume arbitrage and middles bettors with funded accounts at multiple sportsbooks |
Now the break-even math, with assumptions stated plainly so you can swap in your own. Say the +EV tier costs $39 and your average flagged edge is 3.5% — a reasonable midpoint, since most flags land between 2% and 5%. At $25 per bet, each bet carries about $0.88 of expected profit, so you need roughly 45 bets a month — ten or eleven a week — just to cover the fee. At $50 a bet, you need half that. The subscription starts making sense around the point you're comfortably wagering $1,000-plus a month with discipline.
For the arbitrage tier, assume a conservative 1.5% average return on total stake. Covering $199 requires about $13,000 in monthly arb turnover — call it twenty-two arbs at $600 total each, or five to six a week. That's achievable for an active bettor, but only with funded accounts at four to six sportsbooks simultaneously, because you never know which two books will form the next arb. Those deposits are real capital sitting in accounts, and they're part of the true cost of the strategy.
How to Build a Fair Line When You Don't Have a Sharp Account
OddsJam justifies its subscription partly by giving you instant access to a "sharp" line — usually Pinnacle or a high-limit book that sets efficient prices. If you're working with SorteCalc, you don't have that API feed sitting in your browser. You need to estimate fair probability yourself, and guessing is not a strategy. Here's how to triangulate a reasonable true price using only the recreational sportsbooks you already have open.
The simplest method is the market midpoint. Pull up the same moneyline on DraftKings, FanDuel, and BetMGM. If all three cluster tightly — say, one shows −155, another −160, another −162 — the consensus is roughly −158. That consensus is usually more accurate than any single book because the market has already absorbed most public information. When a fourth book, like Caesars, is still dealing −145 on the same side, you've spotted a potential gap. It might be stale; it might also be your edge.
But a raw midpoint still includes the vig. You need to strip it. Take a two-way market where both sides are priced −110. Each implies 52.38%, for a raw total of 104.76%. Divide each side by that total and you get a fair probability of 50% flat. That's the easy case. In the real world, lines are lopsided. Suppose DraftKings offers a tennis match at −170 (implied 62.96%) versus +145 (implied 40.82%). The raw sum is 103.78%. Divide each number by 103.78 and the fair estimates come out to roughly 60.7% and 39.3%. Do the same for FanDuel and BetMGM, then average the three fair estimates.
Let's run the full example. You see this tennis line across three books:
| Book | Favorite | Underdog |
|---|---|---|
| DraftKings | −170 | +145 |
| FanDuel | −175 | +155 |
| BetMGM | −172 | +148 |
Stripping vig from each, then averaging the fair probabilities, gives you a consensus true price of about 61.5% for the favorite and 38.5% for the dog. Now you check Caesars and see they haven't moved yet — their underdog is still +162. Plug +162 into your SorteCalc EV calculator alongside your 38.5% true probability. The calculator returns positive EV. Not a monster edge — roughly 2.1% — but it's real, and you found it without touching a sharp book.
Three warnings. First, when books disagree widely — say, one has +140 and another has +180 — that spread usually means news is in motion, not that you've found value. Wait for the steam to settle. Second, never use a single recreational book as your truth; all of them shade lines toward public sentiment. Third, market consensus fails in thin markets. A random mid-major college basketball game might only have action at two books, and those two books might be copying each other. In that situation, there is no fair line to find; you're flying blind, and a calculator can't fix that.
The Exact Cost of a Legged-Out Arbitrage Bet
Arbitrage looks bulletproof on paper because the math is symmetric. Live betting is not symmetric. Your two bets are separated by a login, a deposit check, a geolocation lag, and the time it takes to thumb through three app screens. In that gap, one line moves. Now you own half a hedge and full exposure. This is called legging out, and it's the single biggest practical risk in manual arbitrage.
Let me show you the damage precisely. Book A has an underdog at +108. Book B has the favorite at −102. The implied probabilities sum to 98.58%, giving a guaranteed profit of about 1.42%. With $1,000 to deploy, the SorteCalc arbitrage calculator tells you to bet $487.73 on the dog at +108 and $512.27 on the favorite at −102. Either result pays back roughly $1,014.50.
You place the $512.27 at −102 on Book B successfully. While you are opening Book A, the line on the dog drops to +100. You now have a choice: place the second side anyway, or abandon the arb and eat a loss on the first leg.
If you bet the remaining $487.73 at +100, your returns split unevenly. A favorite win pays $1,014.50, same as before. But an underdog win at +100 returns only $975.46. Your expected result, assuming the match is actually a coin flip, is ($1,014.50 × 0.5) + ($975.46 × 0.5) = $994.98. You turned a guaranteed $14.50 profit into an expected $5 loss. One second of line movement cost you about nineteen dollars in expected value. If the dog line had dropped to −105 instead of +100, the picture turns solidly red.
What should you actually do? I follow a hard rule: never chase an arb with the second leg unless the remaining price still yields positive expected value against your own fair line. If the original fair probability was 50% and the new line implies 52.4% (−110), you're no longer interested. Close the app on Book A and treat the Book B ticket as an unintentional −102 wager. If the −102 side still holds marginal value — say your fair line had the favorite at 54% — you might complete the bet knowing you're taking slight −EV on the second leg but reducing overall variance. That's a judgment call, not a formula.
Professionals budget for this. A manual bettor working without an integrated API should expect to leg out on a meaningful minority of live arbs, depending on the sport and how many books are involved. The defense is stake sizing: never put more than 2% of your total bankroll on any single arb. If you do get caught, the damage is tuition, not a disaster. Automated tools like OddsJam reduce this rate because they send you to both books simultaneously, but they don't eliminate it — their feeds have latency too, and if a line crashes while your finger is hovering over the confirm button, you are in the same hole.
Account Limits: The Hidden Cost No Calculator Shows You
Every profitable bettor eventually meets the same wall: the sportsbook drops their max bet from $500 to $50, then to $5, then removes access to boosts and promo bets. The industry calls this getting limited or gubbed. It isn't illegal — the book is a private business and can choose its customers — but it functions as a progressive tax on your operation. The faster you find mathematically perfect bets, the faster this wall arrives, and that timing differs sharply between an OddsJam workflow and a SorteCalc workflow.
Automated scanners create correlated signatures. When OddsJam flags a +EV player prop, many other subscribers see the same flag within the same minute. A risk management algorithm at the sportsbook notices a sudden cluster of maximum allowable bets on an obscure market that usually sees little action. That pattern screams sharp action. Your account can get flagged before the game begins. Once tagged, you are not banned; you are simply capped. A $1,000 limit becomes $50. Now you need twenty bets to place the same aggregate stake, which multiplies your effort and increases the chance of another flagged pattern.
Manual bettors move slower and more erratically, which is actually protective. If you spend Tuesday evening comparing college basketball totals across three books and place two bets you calculated by hand, you look like an engaged hobbyist rather than a bot. The selections are likely scattered across different markets — one total, one first-half spread, one moneyline — because you are following your own reading, not a centralized feed. Books make money on volume; they don't sweat the occasional smart amateur. A manual bettor placing only a few scattered, well-researched bets often runs small +EV accounts for years without meaningful limits because the activity mimics recreational variance.
The trade-off is volume. You will place fewer bets, and your edges may be smaller because you lack the real-time precision of a sharp feed. But your account inventory retains value longer. That matters more than people admit when they price out a subscription. A healthy account at a major book is worth something beyond today's stake: it is access to future reload offers, odds boosts, and free bet promotions that gubbed accounts cannot touch. Put a rough number on it. Say a healthy account collects $25 a month in free bets and boosts — a modest assumption for a major US book — and you convert those to cash at 60–70% of face value by hedging, which is a normal conversion rate for a disciplined bettor. That works out to $15–$18 a month, or $180–$210 a year, per account. Treat that as an illustrative estimate, not a measured industry average; your actual figure depends on the book and how aggressively it markets to you. But if OddsJam's speed costs you one healthy account every quarter, that lost promotional value belongs in the math against the subscription fee.
The only honest rule I know is this: bet size and frequency drive limits more than win rate alone. Sportsbooks will tolerate a customer who wins five figures over six months if the bets were small chunks on marquee games. They will not tolerate a customer who wins a smaller amount in two weeks via large chunks on niche markets. If your bankroll is under $5,000 and your average ticket is under $100, manual calculation through SorteCalc is not just cheaper — it is structurally better suited to your scale. Graduate to the automated feed only when your stakes are large enough that your lifetime value at a book is already negative, meaning you have no accounts left to protect.
Sources
- OddsJam — Claims regarding OddsJam's features, pricing tiers, and the list of sportsbooks it scans.
- Investopedia — The definitions and financial principles behind 'Expected Value' (EV) and 'Arbitrage'.
- Pinnacle — The concept of a 'sharp sportsbook' and why their low-vig lines are often used as a benchmark for 'true odds' when calculating EV.
- American Gaming Association — General context and statistics about the legal U.S. sports betting market, which is the primary environment where these tools are used.